Menu Close

MEASURE TERMINAL PERFORMANCE WITH TOPS KPI

Achieve greater visibility over operations and accomplish your goals.

Understand the health of your terminal better.

TOPS KPI is a new addition to the TOPS Expert and TOPS Expert Cloud package to help manage and control terminal operations. TOPS KPI is a remote management and data analysis/mining tool that allows the terminal management at any time to analyze the current performance of their terminal and to also view its past performance. The terminal’s performance can be monitored from any location and any browser with access to the terminal’s network via the Internet or Intranet. The dashboard figures are constantly updated directly from the operational system.

MAIN SCREEN

On the main screen, it displays the Total Terminal View of the TOPS KPI Dashboard, which shows the key figures of the core business areas of the terminal, covering all assets of waterside and landside operations. The tool displays the most relevant data of vessel operation, for example, ETA, ETD, discharge/load moves, CHE performance figures, and many more.  

A comprehensive insight into the yard is provided with the tool as it shows KPI figures of yard activities per hour or block, as well as the overall yard utilization, the split of import, export, and transshipment containers. Gate activities and truck turnaround times are essential for terminals and are displayed too.

The key functions and features of TOPS KPI are:

  • Total Terminal View

  • CHE Performance by CHE Type

  • CHE Performance for a Vessel

  • CHE Idle Time

  • Discharge/Load Moves for a Vessel

  • Yard Activity per Hour

  • Yard Activity by Block

  • Truck Activity

PRIMARY BENEFITS OF TOPS KPI DASHBOARD

ANALYZE . STRATEGIZE . ACHIEVE

Analyzes and reports all of your critical business metrics with the TOPS KPI Dashboard, for faster decision making. As a terminal manager, you do not have the time to monitor and analyze every single business process in detail. Therefore TOPS KPI would be your perfect companion to help you strategize for your terminal’s future, using the metrics provided.

Key-Performance-Indicators (KPIs) can act as a scorecard to enable you to prioritize information and continuously monitor whether you are on track to meet your business goals. The TOPS KPI Dashboard provides a framework to analyze, manage, and to achieve the desired business results.

Heightened Visibility

Being able to increase visibility into specific areas of your terminal operation, with customer service, helps to identify areas that need improvement and allows you to visualize the correlation between error-free operations and improved profits.

Faster Decision Making

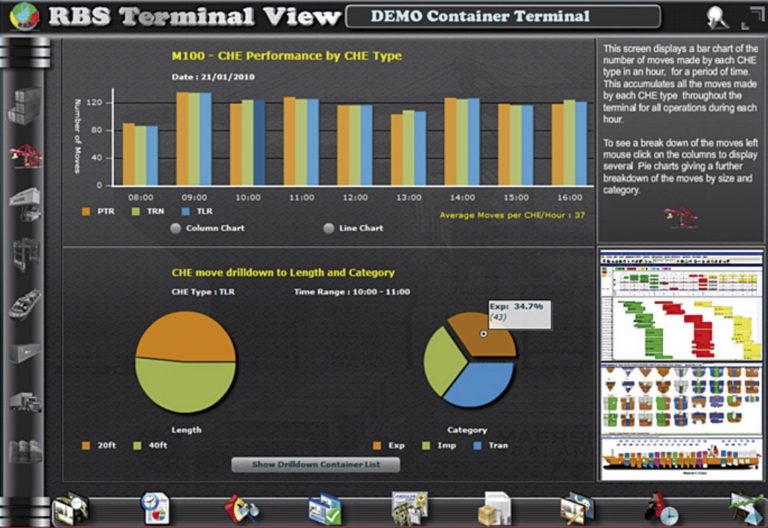
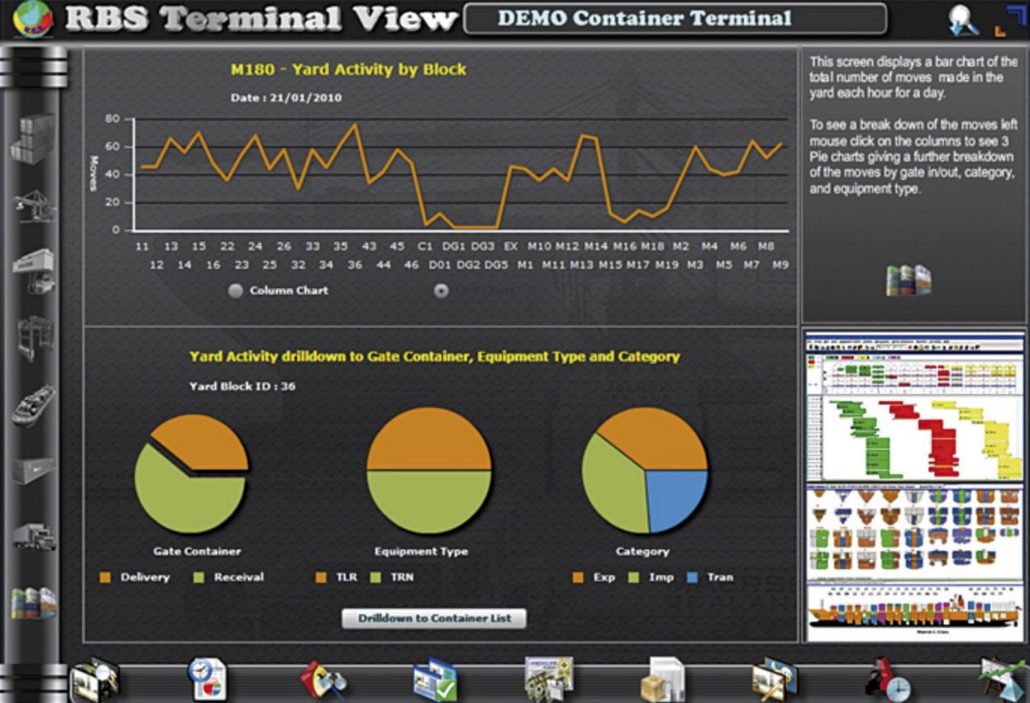
The TOPS KPI dashboard displays an instant snapshot of the performance of the current operation of your terminal – at any time and from everywhere. As a terminal manager, you do not need to wait for specific reports – all relevant information is immediately available within the dashboard.

Time Efficient

The TOPS KPI dashboard reduces the amount of time needed to collate reports and analytics compared to traditional KPI reporting approaches. A simple KPI dashboard displays all your critical information at a single glance, saving time, and resources.

Increased Focus

Users can always immediately access their KPIs and performance data, whether they are in a meeting, on the road or at their desk. Standard PCs, tablets or even smartphones grant accessibility which allows you to remain focused on your terminal’s performance despite any distance.

Want to get in touch?

We are looking forward to discussing your next project.

en_AUEnglish